
The GPU number is not the compute product
A quote for 512 H200s is easy to compare with another quote for 512 H200s. The harder question is whether either supplier can start, finish, and recover your job at the cost and deadline you were promised.
This is the distinction I would make before buying neocloud capacity or designing a shared GPU fleet. The accelerator matters. The topology, scheduler, isolation policy, failure handling, and application workload determine what that accelerator becomes as a product. A fleet can show idle devices while your eight-GPU job cannot get an acceptable placement. It can show high utilization while the useful training steps or inference responses per dollar are poor.
The scenarios below are design exercises, not measured results from a named provider. They are meant to turn a glossy capacity claim into questions a buyer and operator can actually test.
Eight available devices are not necessarily one usable allocation
Imagine an eight-GPU training job whose collective communication needs a specific connectivity and bandwidth envelope. One provider has eight nominally free devices in one fabric domain. Another has eight free devices scattered across hosts, with different peer paths and competing traffic. Both dashboards can truthfully say “eight GPUs available.” They cannot promise the same job-start time or step time without further evidence.
This is not an argument that a job must always live inside one box. Distributed training can span nodes. It is an argument that placement and measured communication cost are part of the SKU. NVIDIA's NCCL performance guidance separates local GPU bandwidth, network bandwidth, and collective-library behavior; its GPU troubleshooting guidance notes that virtualized topology exposure can itself degrade performance. Fabric Manager documentation even describes asymmetric NVLink bandwidth for some four-GPU virtual machines on H100/H200 systems. None of those documents tells us how a particular provider performs. They tell us what to measure on the actual placement.
I would stage the evidence. Before a contract, ask for the offered placement class, network and sharing terms, service envelope, and any representative topology or run data the provider can share. That is enough to decide whether a pilot is worth buying; it is not proof of your own workload. In a scoped pilot allocation, record nvidia-smi topo, run nvbandwidth, a cross-node network probe, and a representative NCCL collective, then run the application itself. A synthetic interconnect benchmark without the application is a diagnostic, not the verdict. A provider need not grant raw production-cluster access before a commercial relationship to make this evaluation possible.
“GPU utilization” is several different measurements
A buyer might see 90% GPU utilization and assume the fleet is delivering 90% of its possible useful work. That conclusion does not follow. NVIDIA DCGM distinguishes graphics-engine activity, SM activity, tensor-pipe activity, memory activity, and NVLink/PCIe traffic. Its documentation says even high SM activity is necessary but insufficient for effective use. An active warp can be waiting on memory. An interval average can hide a burst and a stall.
For a provider, the relevant numerator is workload-specific: accepted training steps, completed fine-tunes, or responses meeting the requested latency and quality envelope. The denominator is the customer's complete cost, including queue time, warm-up, failures, checkpoint/restart overhead, and any reserved but unavailable capacity. Hardware counters help explain a poor result; they do not replace that result.
The operational report I would want has at least two views: device diagnostics and customer outcome. For inference, show request rate, time to first token, output throughput, tail latency, cancellations, and cost per accepted response under a stated concurrency mix. For training, show time to first usable allocation, step-time distribution, completed-run time, checkpoint overhead, and cost per completed run. A buyer can request a sample report before signing and evaluate its own job during a pilot; an operator should keep both distributions internally, not just a fleet mean.
Partitioning does not create another whole GPU
MIG is useful because it can carve supported GPUs into isolated instances with defined compute and memory profiles. That can let several right-sized workloads share a device without all of them contending in the same way. It also creates a shape-matching problem. A job that needs a larger continuous profile cannot use an arbitrary sum of small fragments.
The NVIDIA MIG guide lists finite profile limits, including up to seven instances on an H200. That means up to seven partitions, not seven H200s worth of memory or compute. The useful question is whether the real workload's memory, compute, isolation, and interconnect needs fit the offered profile. If a provider advertises fractional GPUs, I want to know the profile, whether reconfiguration interrupts tenants, what happens when demand shifts to larger jobs, and which performance guarantees survive sharing.
The same principle applies to scheduler labels. Kueue can manage job admission, quotas, lending, borrowing, and fair sharing; node placement remains a separate Kubernetes responsibility. A named queue does not tell a customer whether their reserved capacity can be borrowed, how it is reclaimed, whether a borrower is preempted, or how much notice either side gets. Kubernetes 1.37's DRA compatibility groups are alpha and disabled by default. When an operator enables the feature and a driver supplies compatibility-group tags, the scheduler can reject incompatible MIG and vGPU combinations earlier. That opt-in admission check is useful, but neither a default guarantee nor a runtime performance guarantee.
The scheduler is a product-policy engine
Suppose Tenant A buys a start-time promise, Tenant B has a burst allocation, and Tenant C runs interruptible batch work. When A is idle, lending that space to B or C improves utilization. When A's deadline arrives, somebody needs an explicit reclaim rule. Is C checkpointable? Can B be interrupted? Does A's job require eight devices in one fabric domain? Who pays for restart time? The answers are commercial and architectural decisions, not implementation details for a queue library to guess.
Backfill illustrates the same distinction. Slurm's scheduling guide says its backfill algorithm should start lower-priority work only when it will not delay the expected start of higher-priority work. That expectation depends on reasonably accurate run-time limits and operational state. A provider can run backfill correctly against its estimates yet still miss a customer's external start-time promise if estimates, failures, or topology assumptions were wrong. I would compare promised and actual start times, then inspect the reservation and preemption trace for every miss. “Backfill broke priority” is too vague to diagnose.
Building the fleet is a different decision from buying a slot
If I were operating the fleet, I would report four capacities: devices discovered, jobs admitted, jobs placed, and workloads that actually start. GPU Operator validation can help establish device readiness, while Kueue handles quota and admission. Neither is a customer application result. A small disposable job on each offered placement class can produce a start receipt tied to its driver, device, topology, policy decision and launch time. That makes the gap between inventory and deliverable service visible.
The release process also belongs in the product. NVIDIA's GPU driver upgrade policy can drain a node and evict non-GPU pods when configured to do so. Its MIG Manager changes device geometry and can disrupt workloads, with some configurations requiring reboot. A canary therefore has to measure customer starts, queue delay and colocated services through the change. A green driver or MIG status alone is too narrow a release verdict. These are proposed canary tests, not changes run on a live cluster for this article.
Sharing needs honest product classes. NVIDIA documents that time slicing offers shared replicas without the memory and fault isolation of MIG, and its replica count is not a proportional compute guarantee. I would sell whole-device, MIG-profile and time-sliced capacity as separate offers with their own isolation, placement, performance and interruption terms. Kubernetes multi-tenancy guidance reinforces that a namespace by itself is not the whole isolation boundary. A customer deciding between those classes deserves their actual workload trace, not a shared fleet utilization badge.
Health and accounting have similar boundaries. DCGM passive health monitoring can observe a running system, while active diagnostics can need idle devices and a planned maintenance window. DCGM job statistics are useful telemetry, but their host-engine lifetime is not an immutable invoice ledger. I would persist separate allocation, policy, job, checkpoint and billing events before selling usage-based service. Those records let an operator explain a stalled or restarted run and let a customer challenge a bill with evidence.
Ten experiments before buying the architecture
I would use shared specifications and sample evidence to screen providers, then run these in a scoped test allocation or disposable scheduler environment before a larger commitment. The operator-only canaries belong on owned test capacity. They are proposed experiments, not tests I claim to have run on Eric's behalf.
- Run a representative single-node and multi-node job on the promised device and record end-to-end cost, not only peak FLOPS.
- Capture the actual GPU, NIC, NVLink and virtual topology for each placement; compare it with the contract's placement class.
- Run local bandwidth, network and NCCL probes, then check whether their differences predict actual job step time.
- Repeat at the advertised concurrency and mixed workload, recording p50 and p95 completion and latency rather than a quiet-system maximum.
- Submit a large topology-sensitive job while the fleet has scattered idle GPUs; measure wait time and placement decisions.
- Fill a device with fractional profiles, then request a large profile; measure fragmentation, reconfiguration cost, and tenant interruption.
- Let a burst tenant borrow reserved quota, then activate the reservation; trace preemption, notice, checkpoint and recovery costs.
- Run backfill with optimistic and pessimistic duration estimates; measure both utilization and missed start-time promises.
- Fail one node or fabric link mid-run; measure detection, checkpoint validity, retry placement, and final accepted result.
- Reconcile every billed GPU-minute with allocation logs, application progress, and customer-accepted work; investigate unexplained idle or restart windows.
The ten runs are a starting design screen. They need the customer's actual model, job size, latency target and failure tolerance before their results mean much. A simpler application can prefer a cheaper, less connected placement. A tightly coupled run may justify a more expensive fabric if it finishes sooner and more predictably.
My buying rule
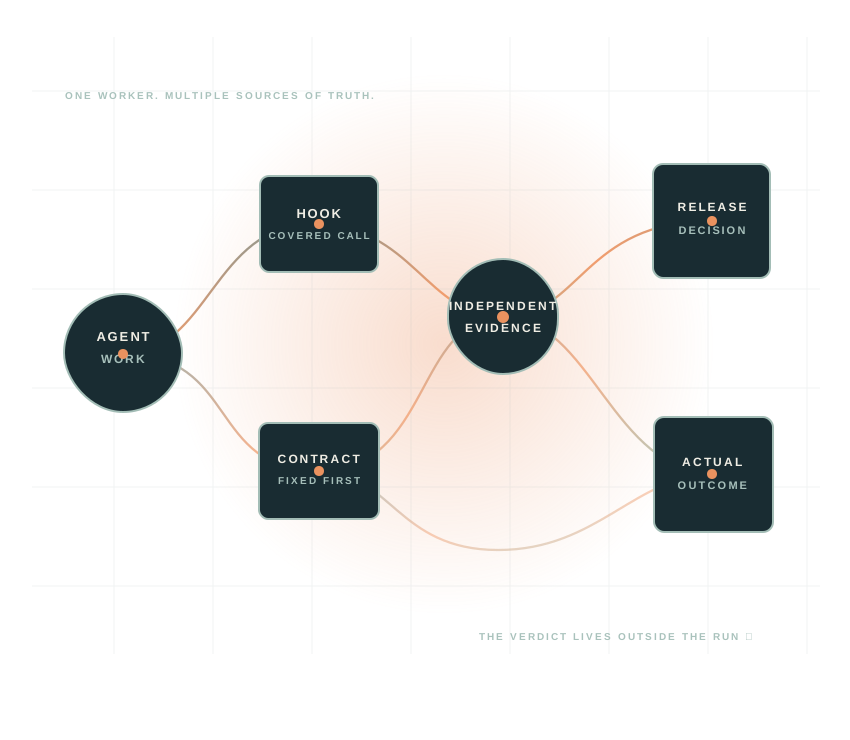
I would screen offers on a promised completed-run envelope, then use a scoped pilot to turn it into an observed envelope: a defined workload, topology class, queue priority, isolation policy, p95 start and completion time, restart behavior, and cost per accepted result. As an operator, I would keep a short diagnostic packet for every miss: scheduling decision, device and fabric health, application trace, checkpoint state, and billing record. As a buyer, I would negotiate what part of that packet can be shared without access to another tenant or the provider's control plane.
That packet gives the operator a causal repair path and gives the buyer a way to compare providers honestly. A GPU-hour price and a utilization badge can start the conversation. They cannot close it.
Further reading
- NVIDIA DCGM profiling metrics
- NVIDIA NCCL performance guidance
- NVIDIA MIG supported devices and profile limits
- Kueue admission and policy overview
- Slurm backfill scheduling guide
The field kit
The companion folder for this week holds runnable examples, decision records, evidence and limits. The repository release log is updated after each article's live readback.